
A task list tells you what has to be done. A Gantt chart tells you what happens if it slips. Gantt Chart for Projects adds an interactive, dependency-aware timeline to Odoo projects, built with OWL components, with drag-and-drop scheduling, automatic date recalculation and critical path analysis.
What Gantt Chart does
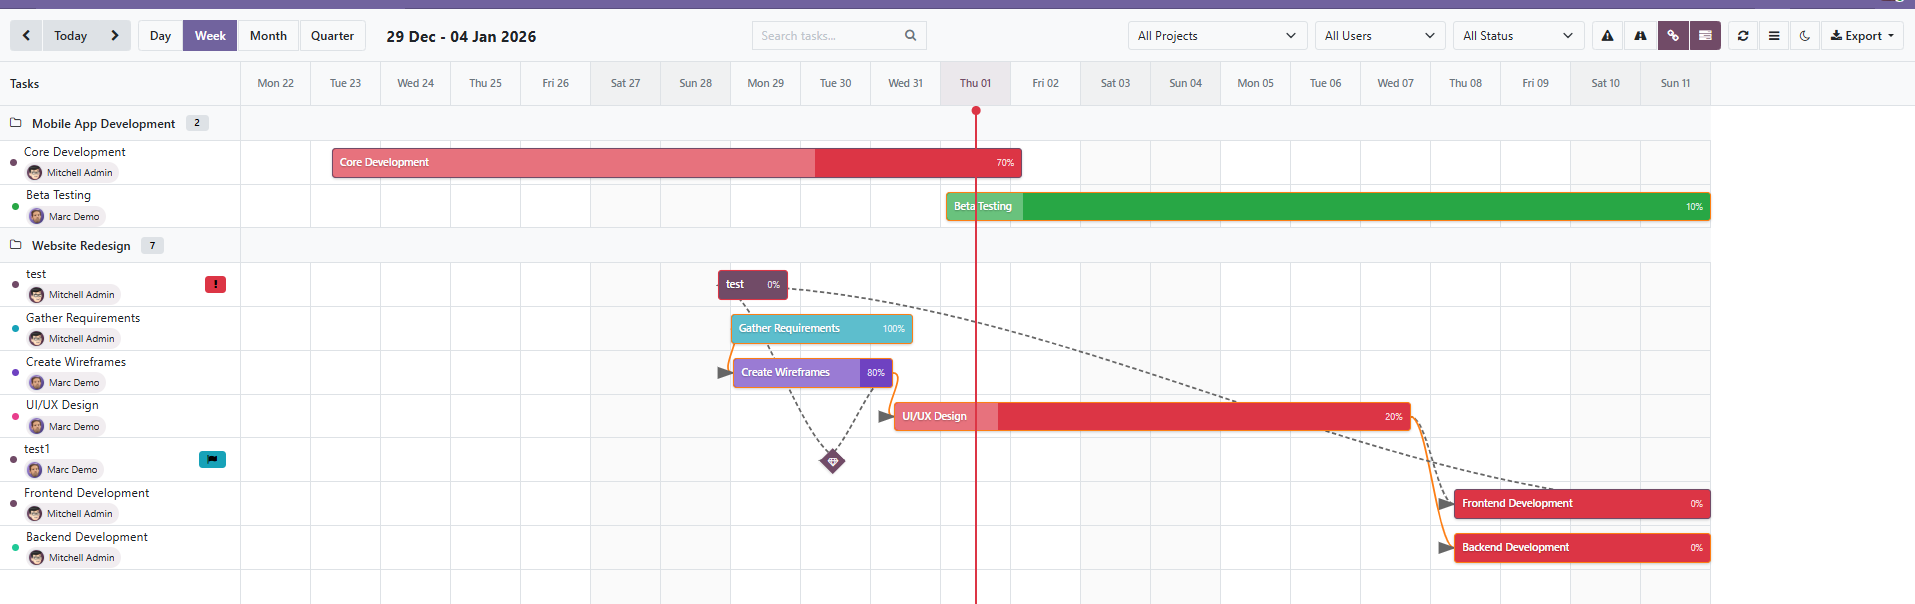
The module renders your project tasks on a timeline you can manipulate directly: drag a task to move it, drag its edge to change its duration, and draw dependency lines between tasks. Dates downstream are recalculated automatically, and circular dependencies are rejected before they can corrupt the plan.
It is available for a wide range of Odoo series — 16.0, 17.0, 18.0 and 19.0 — which makes it usable on long-lived production databases, not only on the newest release.
Watch the demo
A full video walkthrough is available here: watch the demo on YouTube.
Key features
Interactive chart built with OWL
The timeline is implemented with Odoo's OWL component framework, so it behaves like a native part of the web client with real-time updates.
Drag and drop, resize
Move a task to reschedule it and drag its edge to change its duration — planning becomes a direct manipulation instead of a form.
Dependency lines
Draw dependencies between tasks and see them as lines on the chart, which is the whole point of a Gantt view.
Automatic date calculation
Dates are recalculated from dependencies when something moves, so the consequences of a delay propagate instead of being forgotten.
Circular dependency validation
Loops are detected and refused, which prevents the class of plan corruption that is painful to unwind later.
Multiple zoom levels
Day, week, month and quarter views, so the same plan serves a daily stand-up and a steering committee.
Resource and team view
See the plan by resource or team, with visual alerts for delays.
Reports
Resource workload, project progress as planned versus actual, critical path analysis and a KPI metrics dashboard.
Export and integrations
Export the chart to PNG or PDF, integrate with the Odoo calendar, send email notifications for deadlines, and run it multi-company.
Screenshots
How to set it up
Configuration lives in Project > Gantt. The full sequence is:
- Add the module to your addons path and install it from the Apps menu.
- Open a project and switch to the Gantt view.
- Set start and end dates on your tasks so they can be positioned on the timeline.
- Draw dependency lines between tasks that must follow one another.
- Drag tasks to reschedule and let dependent dates recalculate, then export to PNG or PDF for reporting.
Good to know
- Depends on
project,hr,hr_timesheetandresource, so timesheet and resource data feed the workload reports. - Available for Odoo 16.0, 17.0, 18.0 and 19.0 — useful if your production database is not on the latest series.
Requirements and compatibility
| Odoo series | Odoo 16.0, Odoo 17.0, Odoo 18.0, Odoo 19.0 |
|---|---|
| Depends on | project, hr, hr_timesheet, resource, mail |
| Licence | OPL-1 |
| Edition | Works on Odoo Community |
Where to get it
See Gantt Chart on buyodoo.com
Browse the full catalogue on the buyodoo.com shop, or contact us if you need help choosing.
Frequently asked questions
Does it work on Odoo Community?
Yes. It builds on the Community project, hr_timesheet and resource modules.
Can I create dependencies between tasks?
Yes, and they are drawn as lines on the chart. Dependent dates are recalculated automatically when a task moves, and circular dependencies are rejected.
Can I export the chart?
Yes, to PNG or PDF, which covers most reporting and client-communication needs.
Does it show the critical path?
Yes. Critical path analysis is one of the included reports, alongside resource workload and planned-versus-actual progress.
Which Odoo versions are supported?
Odoo 16.0, 17.0, 18.0 and 19.0.