
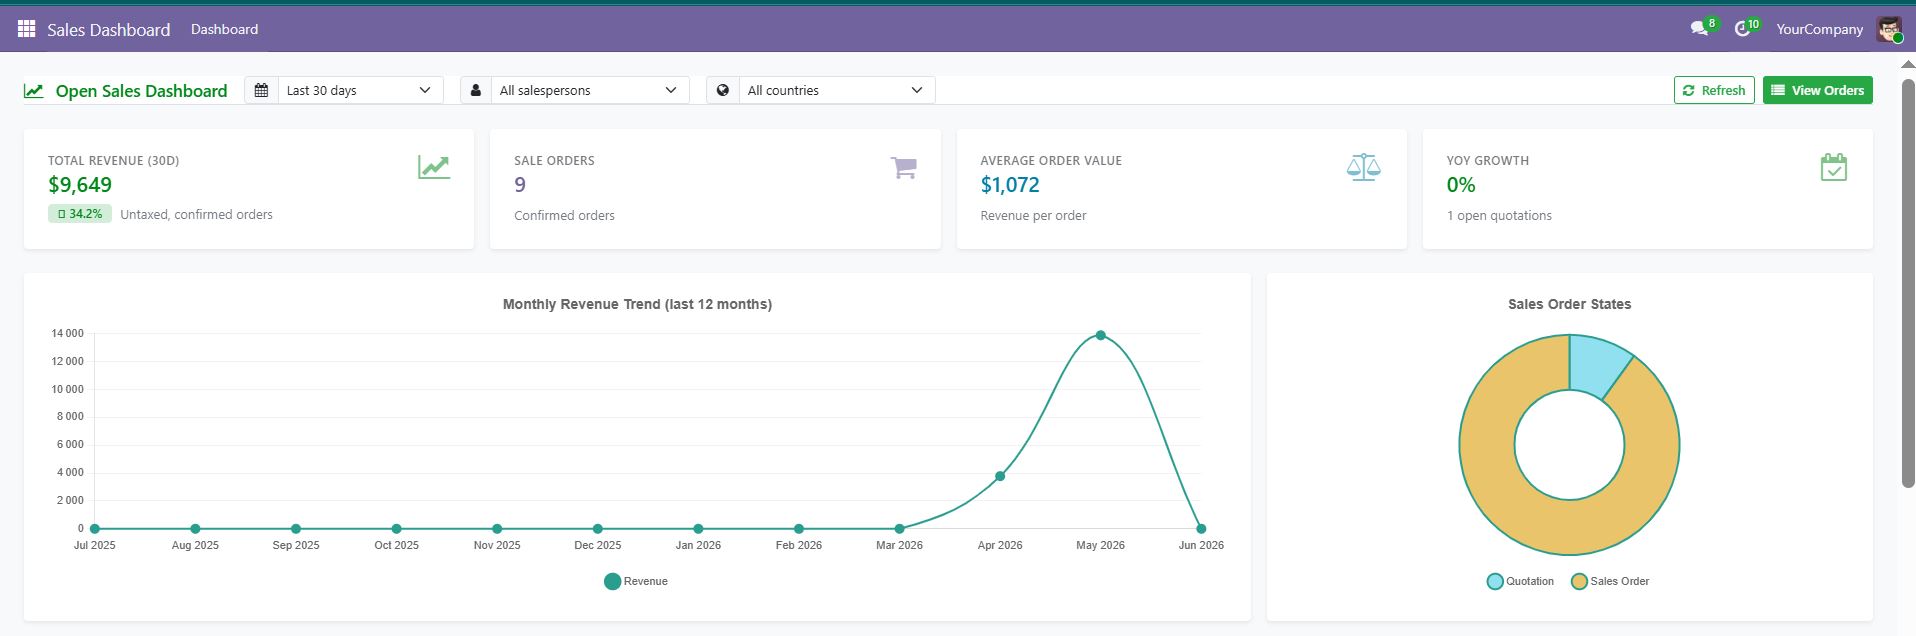
Sales data in Odoo is complete but scattered: revenue in one report, products in another, growth nowhere. Open Sales Dashboard collapses that into a single interactive screen for Odoo 19 — total revenue, monthly trends, growth rates, best products, best salespeople and revenue by country, each one clickable down to the underlying orders.
What Open Sales Dashboard does
The dashboard reads your existing sales orders. There is nothing to migrate and no parallel data to maintain — install it and the figures are there.
Every tile and every chart is a filter in disguise: click a country, a product or a salesperson and you land on the matching sale orders in a standard Odoo list, where your usual filters and exports still work.
Key features
Sales performance overview
Total revenue and total sale orders at a glance, for the period you select — the two numbers a manager asks for first.
Monthly revenue trends
Revenue plotted by month, which is what makes forecasting and seasonal analysis possible instead of guesswork.
Growth tracking, MoM and YoY
Month-over-month and year-over-year growth are computed for you, so a good month is immediately readable as good relative to what.
Geographical sales analysis
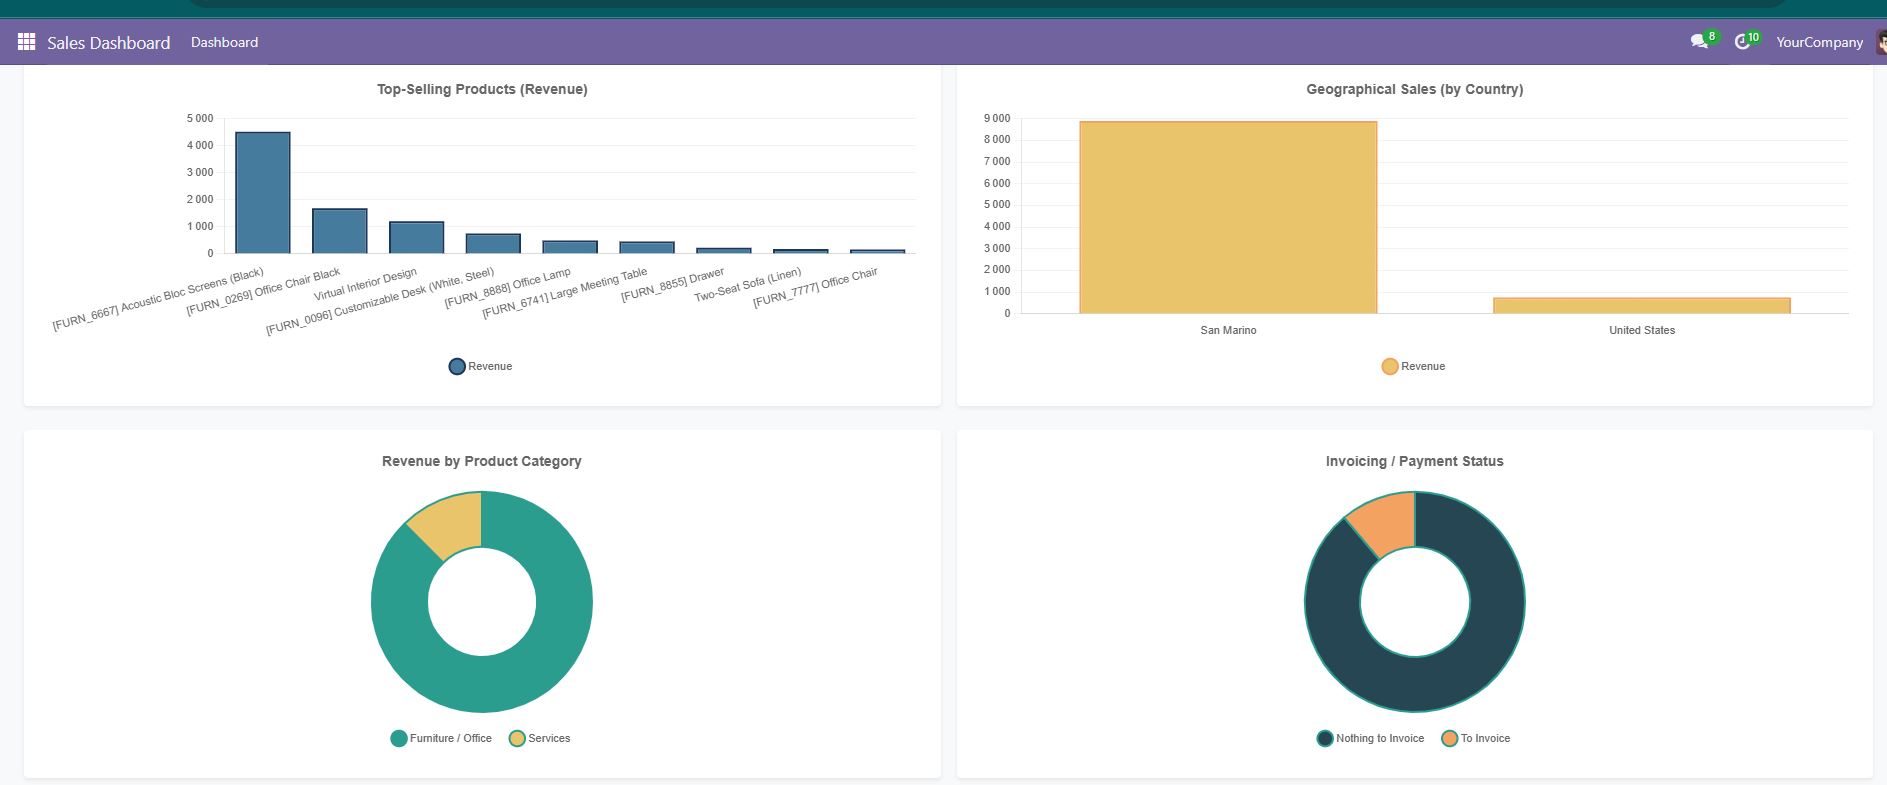
Revenue broken down by customer country and region — the fastest way to spot a market that is quietly growing or quietly dying.
Top products and categories
Best-selling products and best-selling product categories, ranked, so assortment decisions rest on figures.
Top salespeople
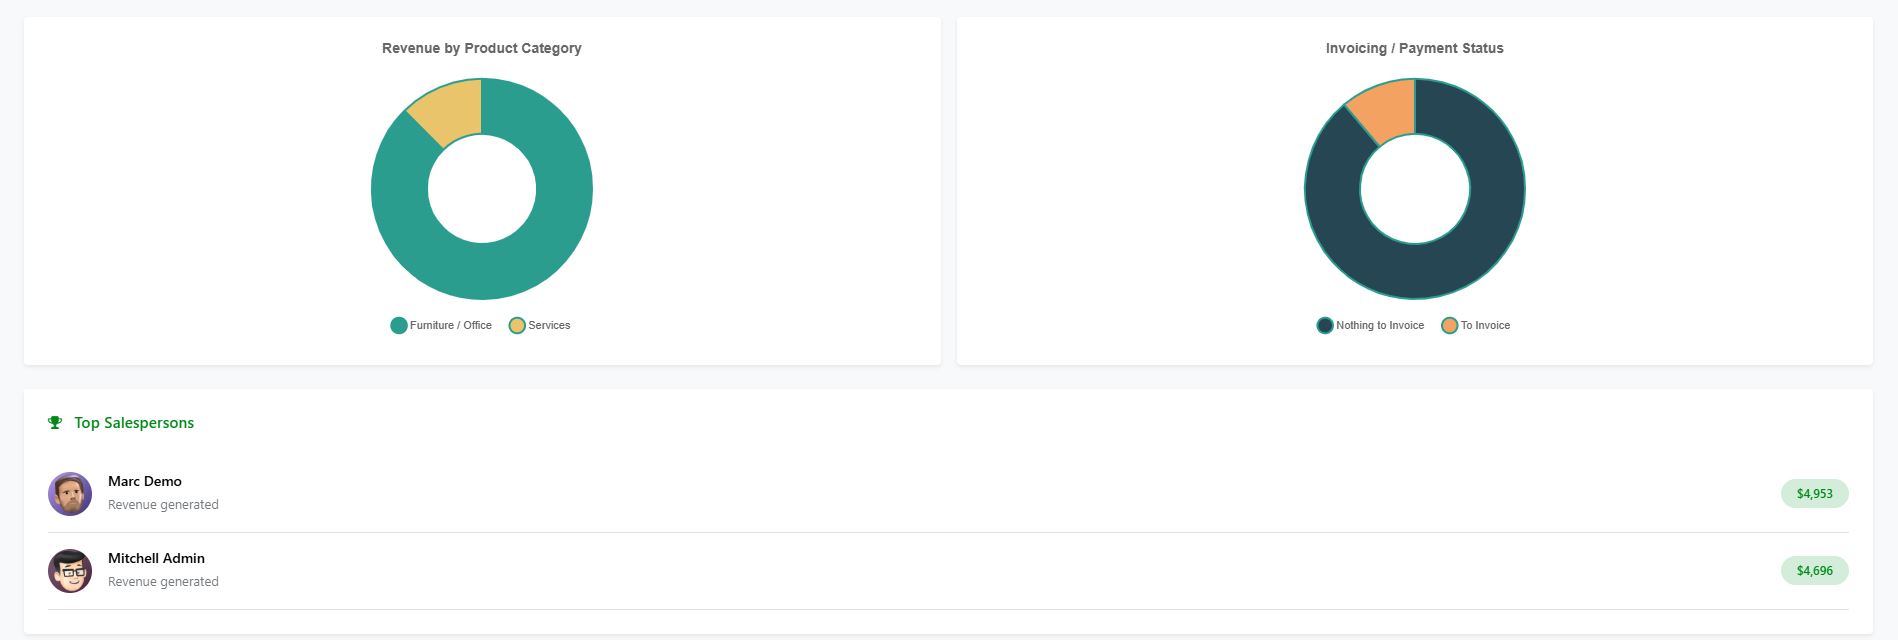
A ranking of salespeople by results, useful for coaching and for commission discussions that need a shared source of truth.
Order and invoicing status
Sales order states plus the invoicing and payment status breakdown, so revenue that is booked but not yet cashed does not hide.
Filters with drill-down
Filter by period, salesperson and country, then drill from any widget straight to the source orders.
Screenshots
How to set it up
Configuration lives in Sales > Dashboard. The full sequence is:
- Install the module from the Apps menu after adding it to your addons path.
- Open the Sales application — a Dashboard entry is added to the menu.
- Set the period you want to analyse using the date filter at the top of the dashboard.
- Narrow the view by salesperson or country when you need a focused read.
- Click any KPI card or chart segment to drill through to the sale orders behind the number.
Good to know
- The module depends on
sale_management; no enterprise application is required. - It is also available inside the Open All Dashboards bundle if you want the sales, purchase, inventory and user dashboards under one tabbed menu.
Requirements and compatibility
| Odoo series | Odoo 18.0, Odoo 19.0 |
|---|---|
| Depends on | sale_management |
| Licence | OPL-1 |
| Edition | Works on Odoo Community |
Where to get it
See Open Sales Dashboard on buyodoo.com
Browse the full catalogue on the buyodoo.com shop, or contact us if you need help choosing.
Frequently asked questions
Does it require Odoo Enterprise?
No. It depends only on sale_management, base and web, so it runs on Odoo Community.
Does it duplicate my sales data?
No. The dashboard reads your existing sale orders directly. There is no synchronisation step and nothing to keep in sync.
Can I go from a chart to the actual orders?
Yes. Cards and chart segments drill down to the matching sale orders in a normal Odoo list view.
What is the difference with the All Dashboards bundle?
The bundle installs the sales, purchase, inventory and user dashboards together and adds a unified tabbed menu. Buy this module alone if sales is the only area you need.
Which Odoo versions are supported?
Odoo 18.0 and Odoo 19.0.